How to Monitor Crop Health with Sentinel-2 (Northern Europe Guide)
2025-08-29 · 3 min read · Agriculture · Sentinel-2
TL;DR: For crop vigor, start with EVI2 (day-to-day stability) and keep NDVI for continuity. Add NDRE for earlier nitrogen signals and SWIR-based moisture indices (e.g., NDMI) to see drought stress before the canopy visibly fades.
What “crop health” looks like in data
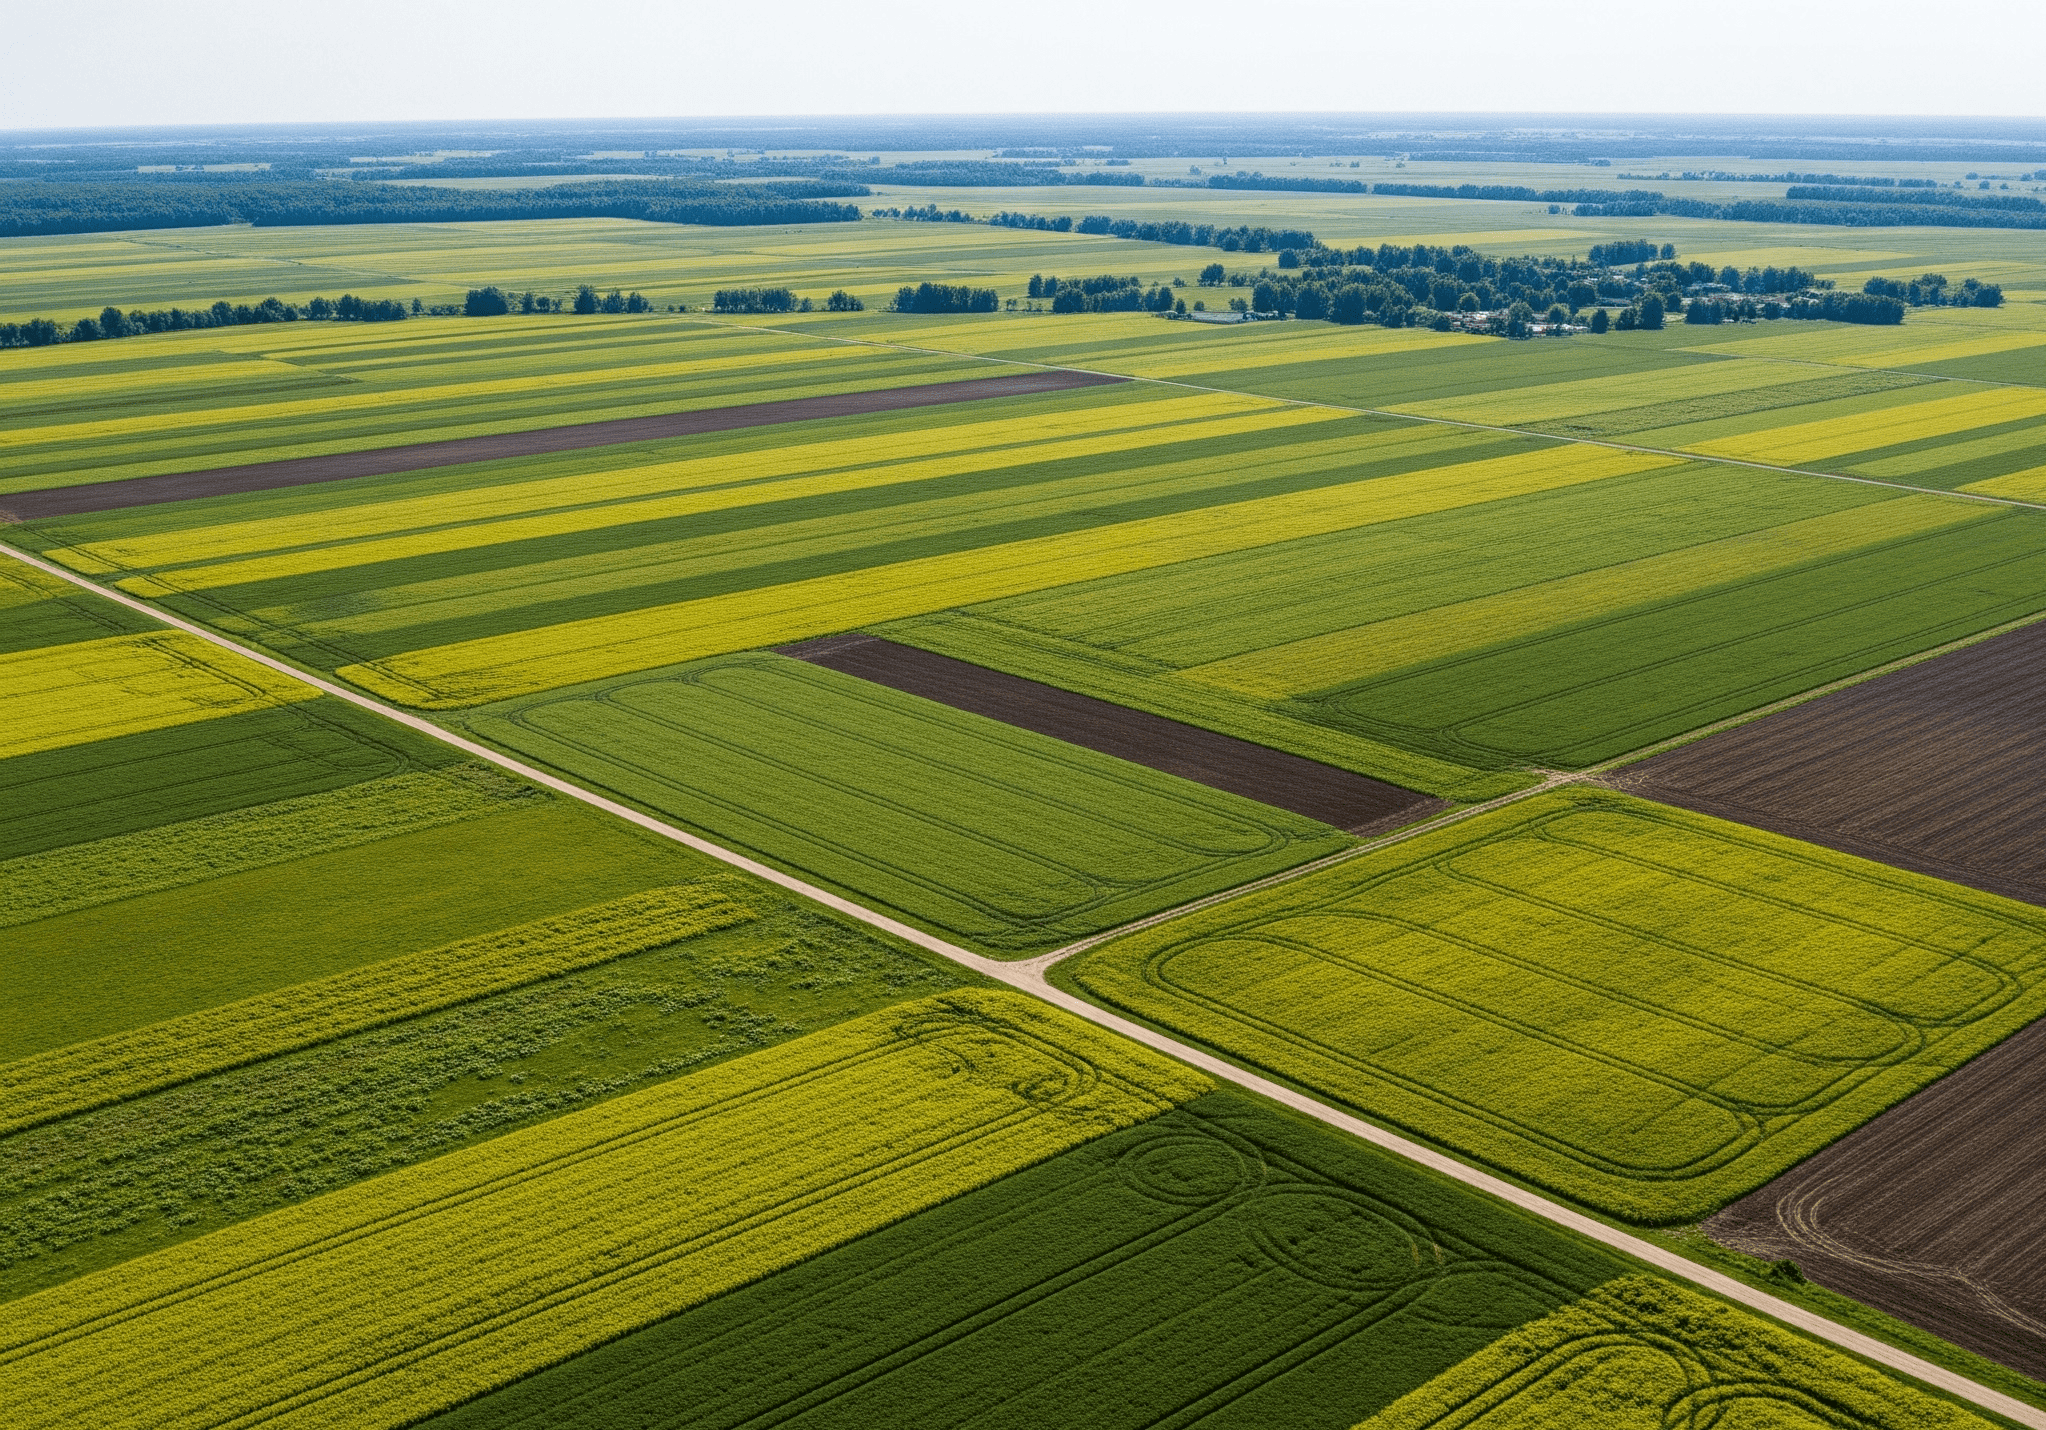
On the ground we talk about even emergence, nutrient sufficiency, water status, disease pressure, and timing of harvest and cover. From orbit those ideas translate into how reflectance in the red, near-infrared, red-edge, and shortwave-infrared bands changes across space and time. Early in the season you’re watching establishment and uniformity; through stem elongation and heading you track vigor and stress onsets; after harvest you distinguish residue, bare soil, and cover to support compliance checks.
Indices to anchor your workflow
Two indices carry most day-to-day crop monitoring: EVI2 and NDVI. NDVI is the universal language of greenness and is excellent for long archives and cross-sensor comparability. EVI2 tends to be steadier over bright soils and thin haze and stays responsive when dense canopies push NDVI toward its upper plateau. That makes it handy for cereals, grass, and oilseed rape at peak biomass.
When nitrogen is the question, NDRE (a red-edge index) picks up chlorophyll changes earlier than NDVI. For water stress, SWIR+NIR combinations such as NDMI fall before vigor indices do, because water absorption in SWIR rises as leaves dry. If you care about biomass and productivity signals across parcels, NIRv (NIR × NDVI) is a strong additional feature provided your inputs are consistently processed.
Work on aligned inputs. On Sentinel-2, Blue/Green/Red/NIR are 10 m while red-edge and SWIR are 20 m natively. Resample once, lock a grid, and compute indices after co-registration.
A field-first way to run it
Start from the business objects you manage: parcels. Decide up front whether you’ll analyze on Level-1C (TOA) for speed or Level-2A (surface reflectance) for cross-date comparability, and keep that choice consistent across the season. Compute EVI2/NDVI for vigor, add NDRE where nitrogen management matters, and track NDMI for moisture. For each composite date, calculate per-parcel statistics (median, inter-percentile range, valid-pixel coverage). Then compare a parcel to itself (deviation from its recent baseline) and to local peers (percentile ranks by crop and planting window). The result is a short, defensible list of fields worth a scout, not a wall of maps.
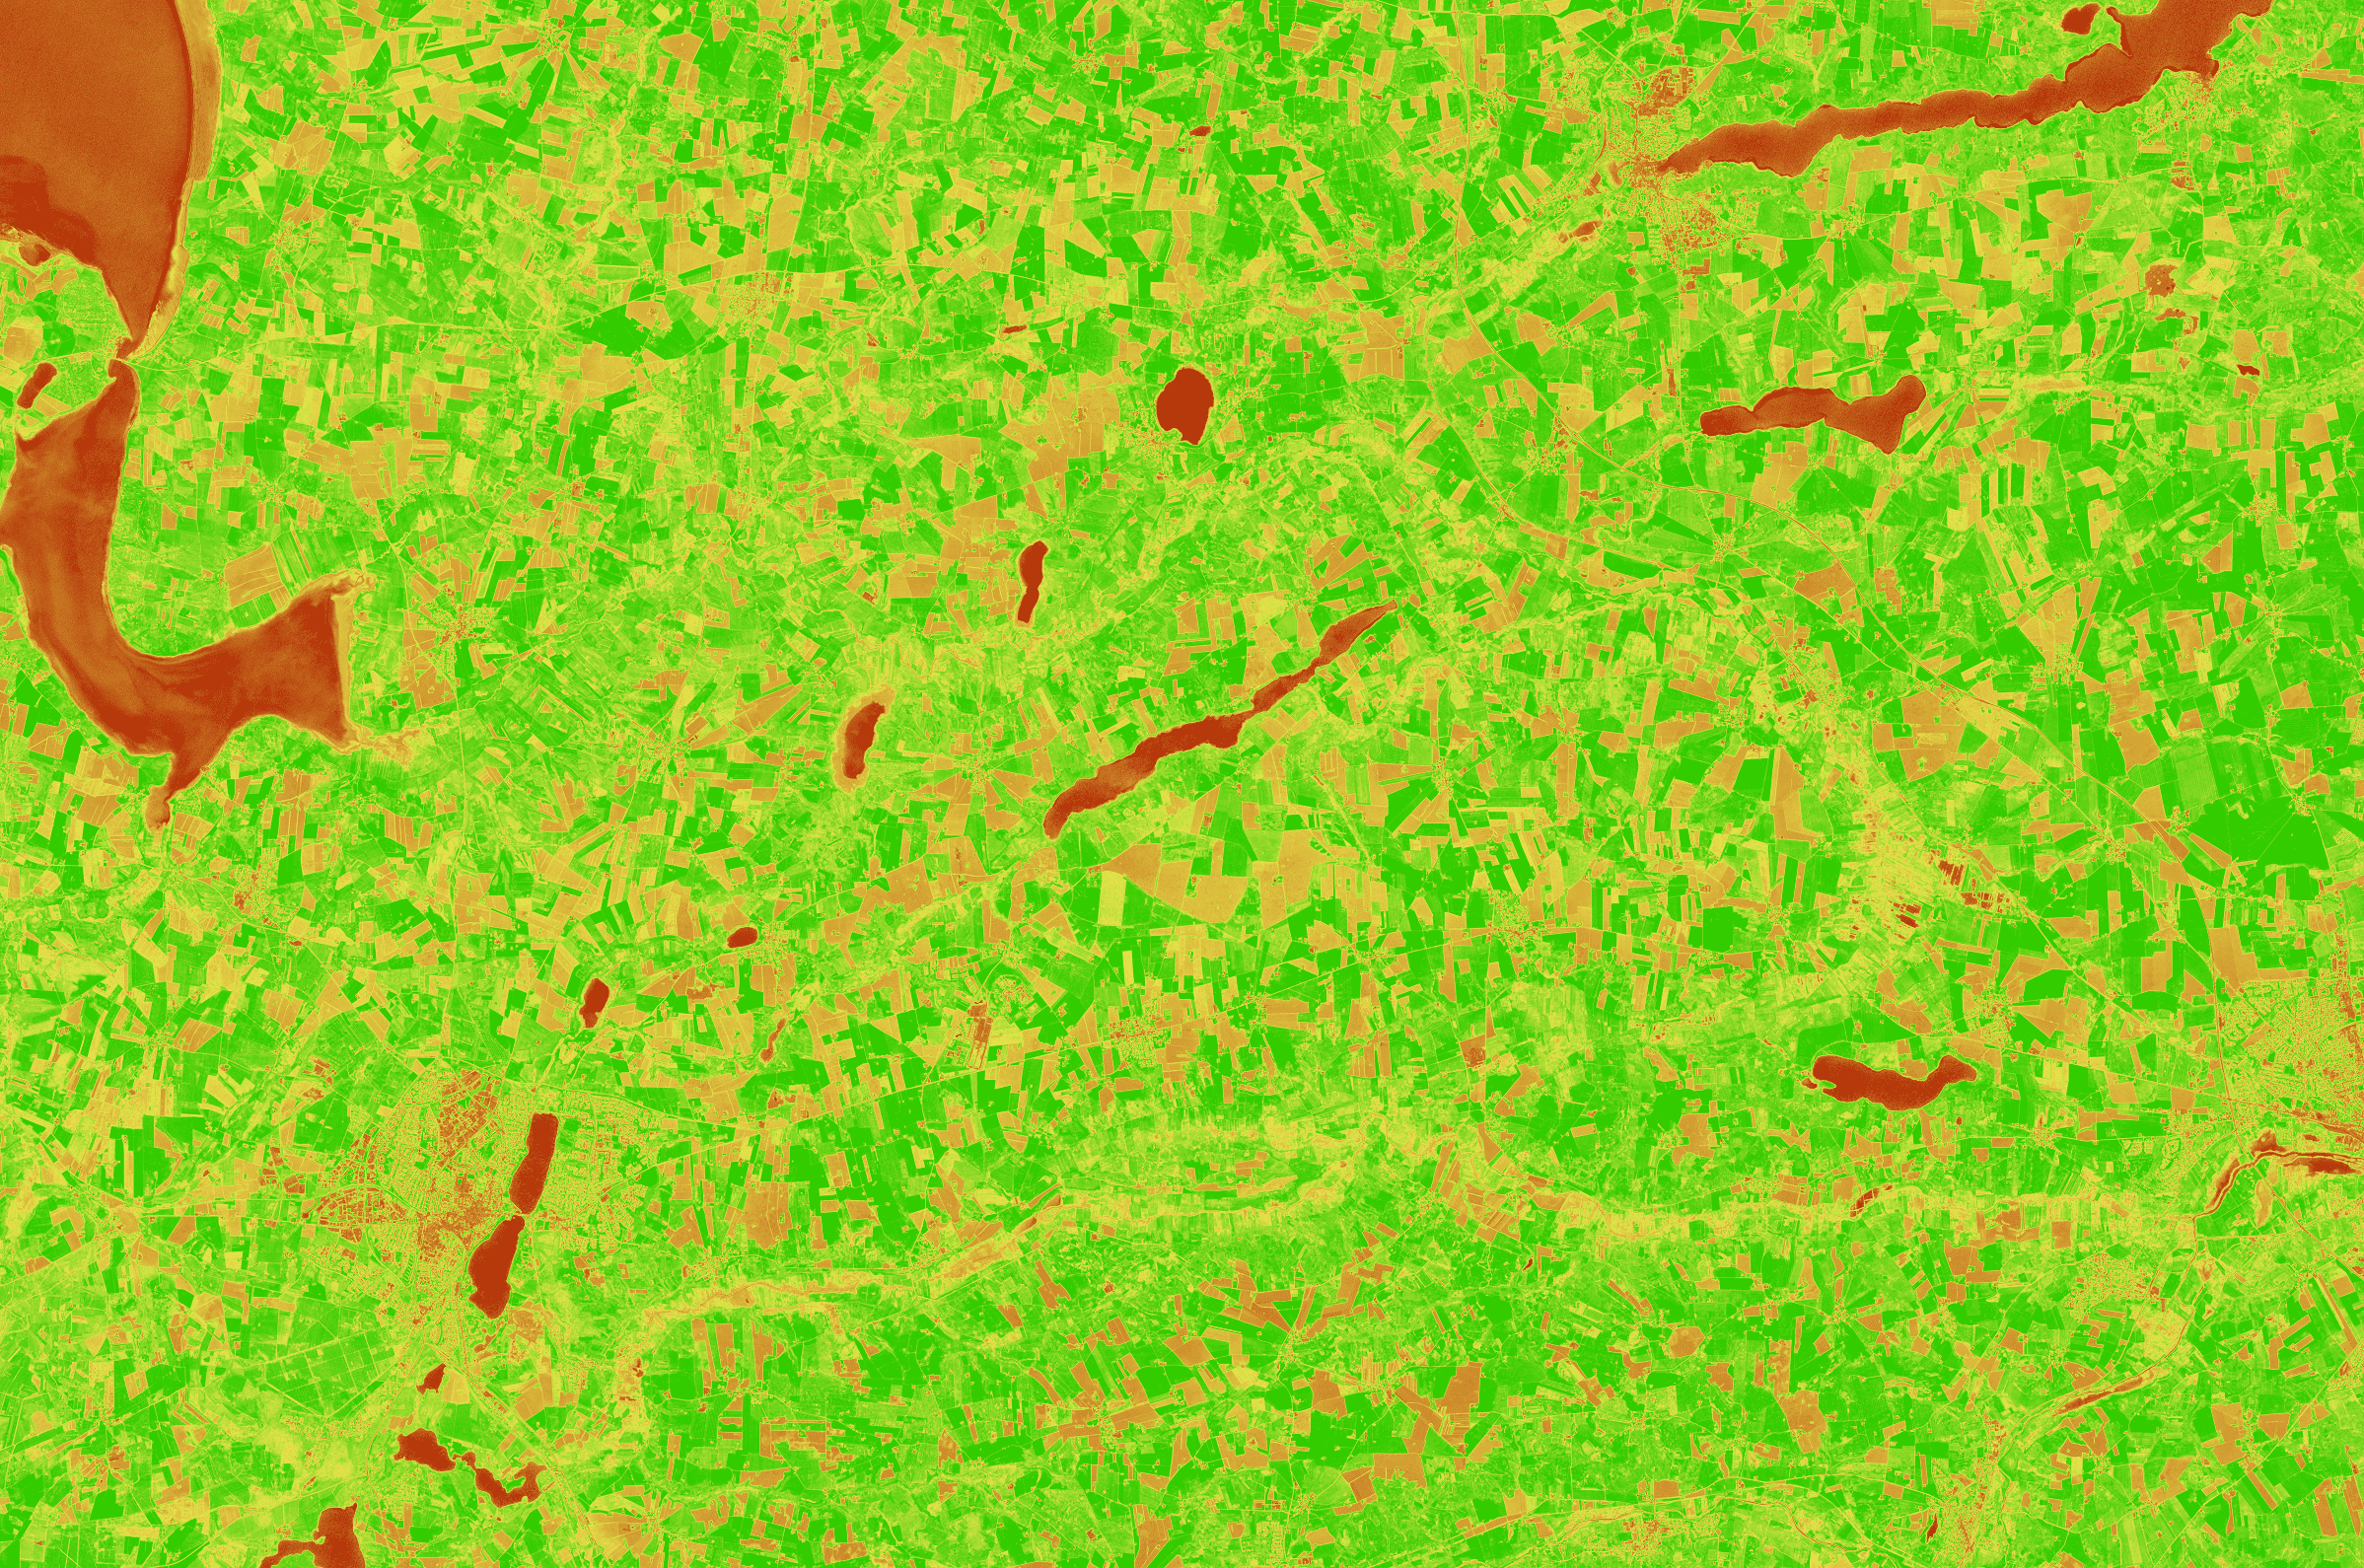
How to read the patterns
Healthy establishment appears as a smooth, field-wide rise in EVI2/NDVI; patchy emergence shows up as elevated within-field variability. Fields drifting low in NDRE relative to neighbors are early candidates for a nitrogen check, especially if vigor is otherwise stable. A slide in NDMI ahead of any drop in NDVI often signals water stress; a step-up after irrigation confirms effect if it persists into the next composite. Sudden, localized declines—particularly near headlands—can flag disease or lodging; texture cues and ancillary data help separate causes.
ClearSKY in practice
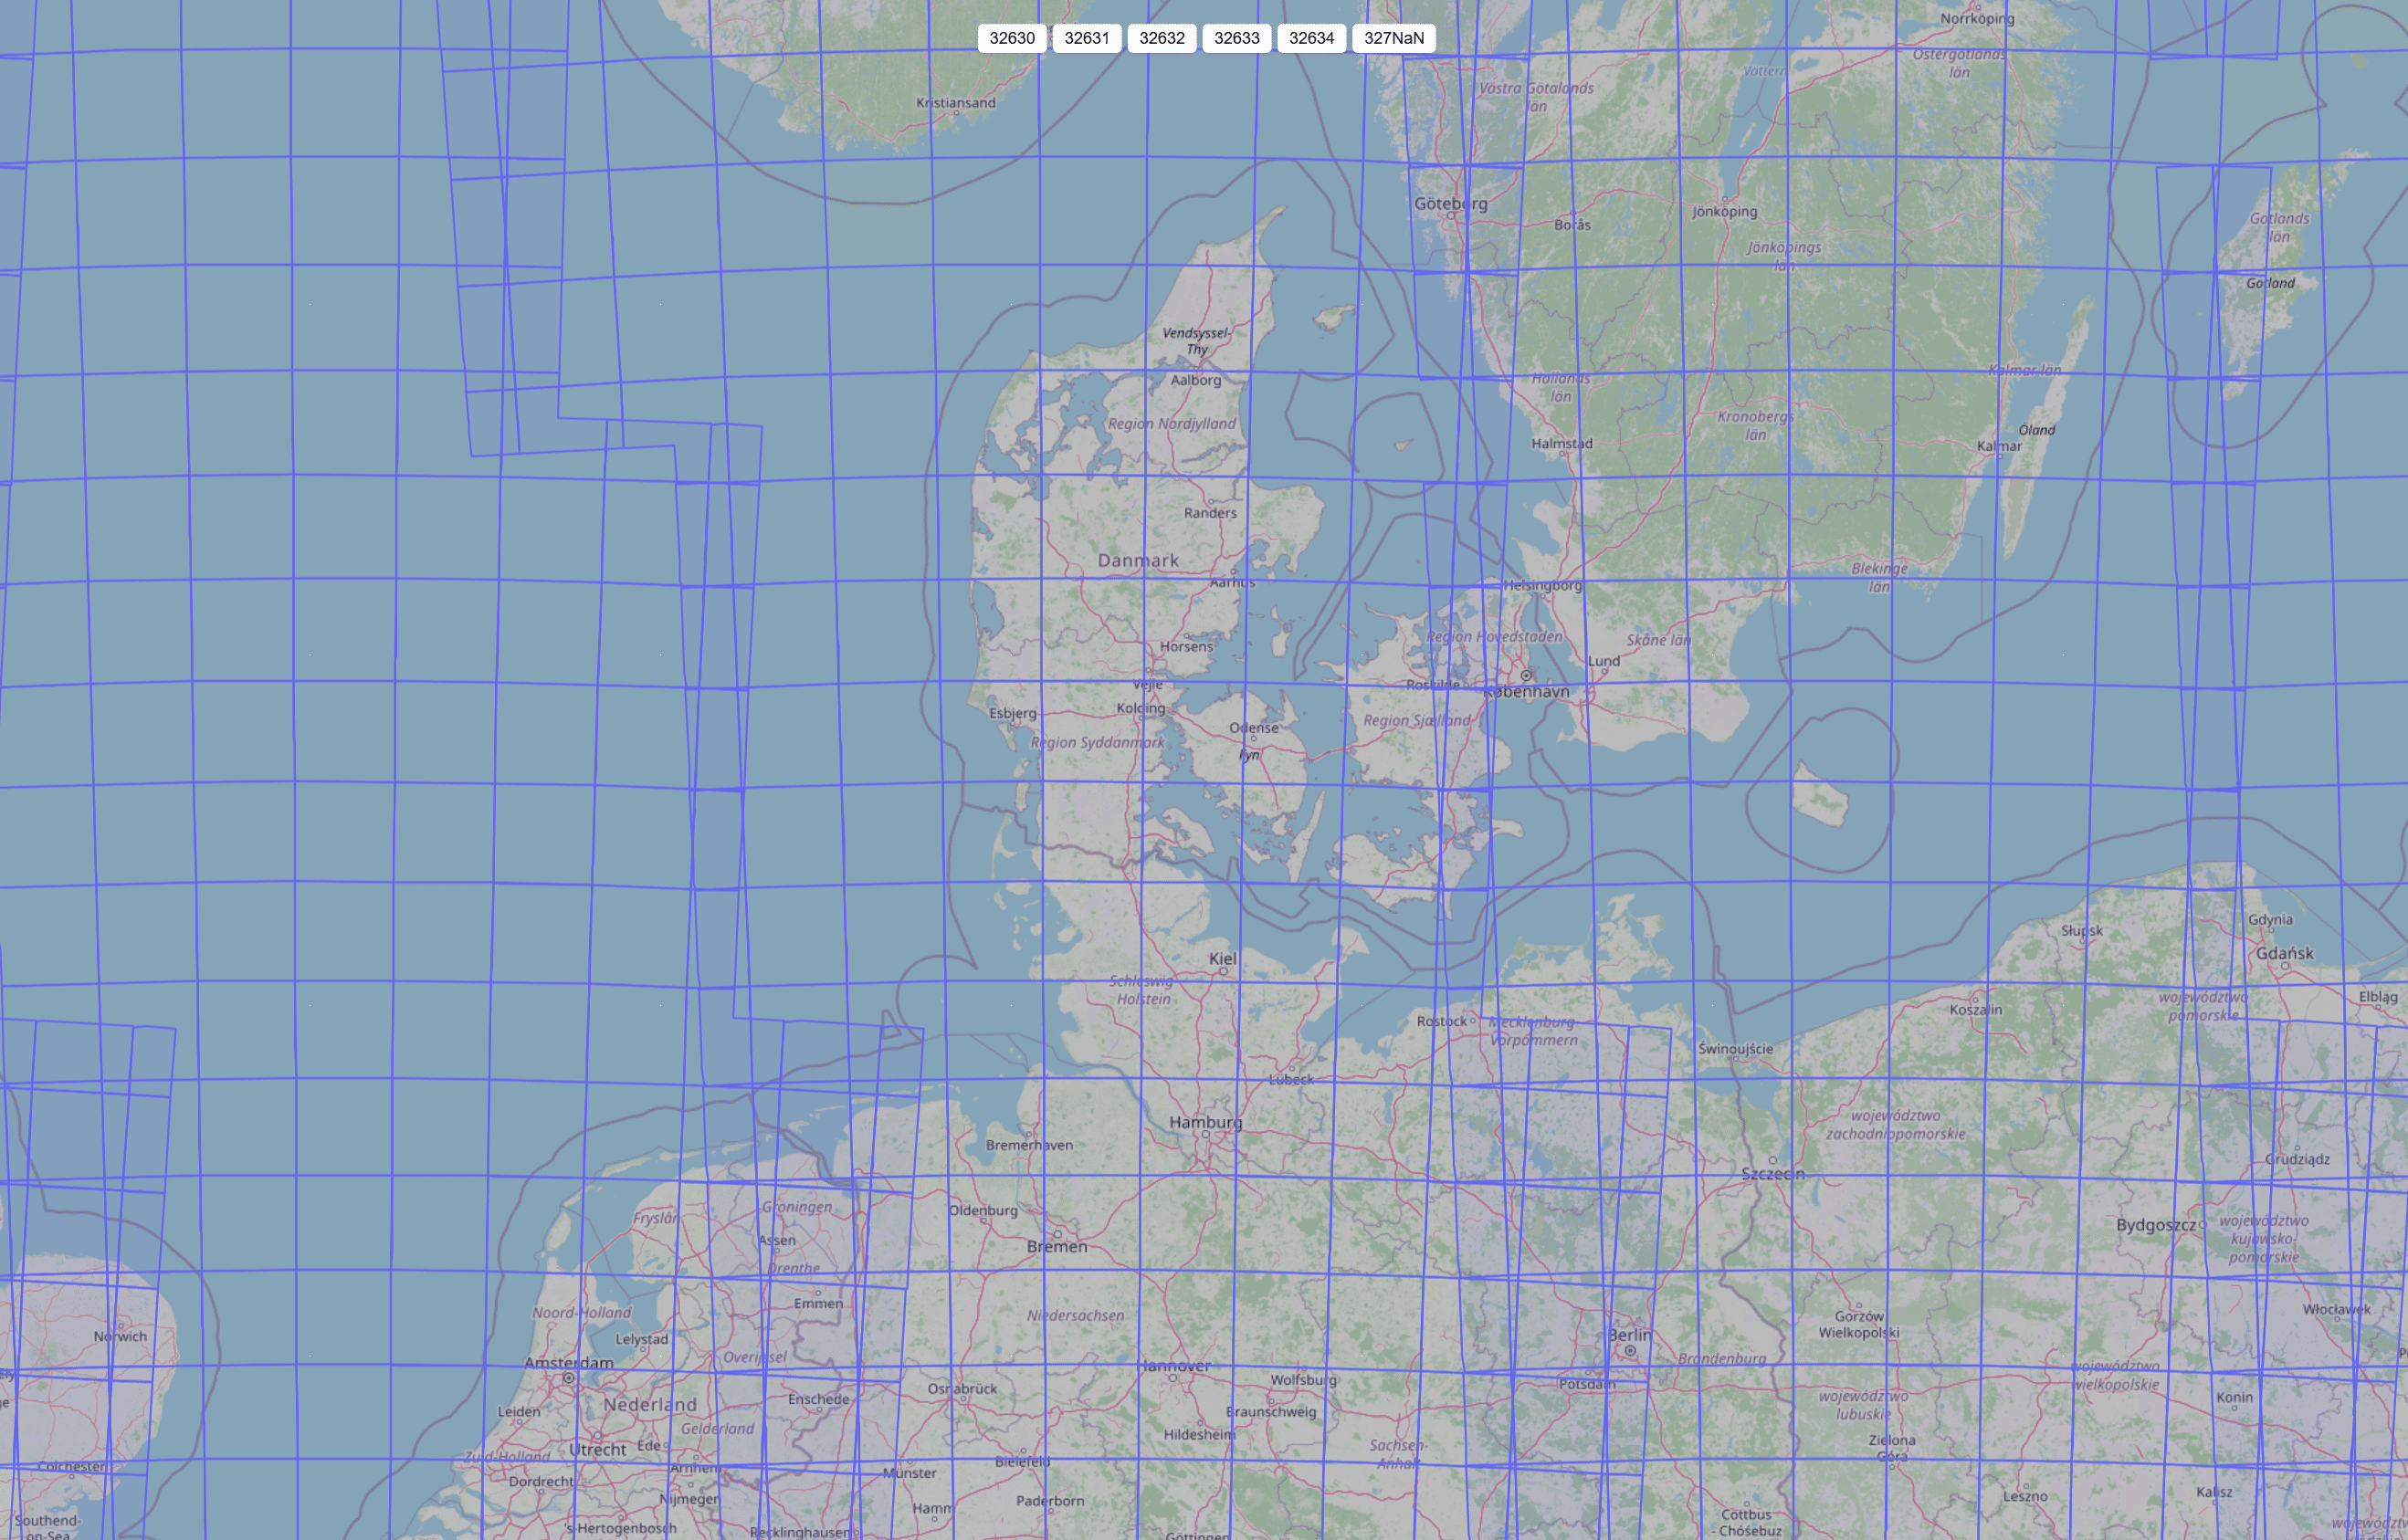
ClearSKY gives you access to multispectral data at Level-1 or Level-2 and lets you return indices with your downloads at no extra cost. If you want ready-to-use layers alongside the source bands, set Bandnames to include what you need—for example B8,B4,[B8_B4] to receive NIR, Red, and an NDVI layer in a single GeoTIFF. Normalized-difference indices like NDVI/NDWI/NDMI can be included at no additional charge; indices such as EVI2 and NIRv are straightforward to compute immediately from the bands we deliver. All outputs arrive aligned at 10 m across the stack, so your red-edge and SWIR-derived metrics line up per pixel without preprocessing. If your AOI straddles multiple UTM zones, analyze per-tile in the native UTM EPSG or pick a single projection once—avoid repeated reprojection hops.
Tip: keep one “communication index” (often NDVI) for continuity with agronomists and dashboards, and pair it with EVI2/NDRE/NDMI in your analytics so you don’t miss early or moisture-driven signals.